7 Reading the Overview
For the owner
- What each part of the Overview tells you.
- What makes a product “need attention”, and what to do about it.
- How to read the figures honestly: what they include, and what they leave out.
7.1 The idea
The Overview is the first tab: a summary of the whole shop on one screen. It answers the owner’s daily questions. What is my stock worth, and is that going up or down? Which types hold the money? What’s selling, and what isn’t? What needs doing? How did the last count go?
Every figure comes from the ledger (Chapter 2), worked out afresh when you open the app. Nothing on the Overview can be typed in.
At the top, 3M, 6M and 1Y choose how far back the charts look: 13, 26 or 52 weeks, this week included. Needs attention always looks at the last 90 days.
7.2 In the app
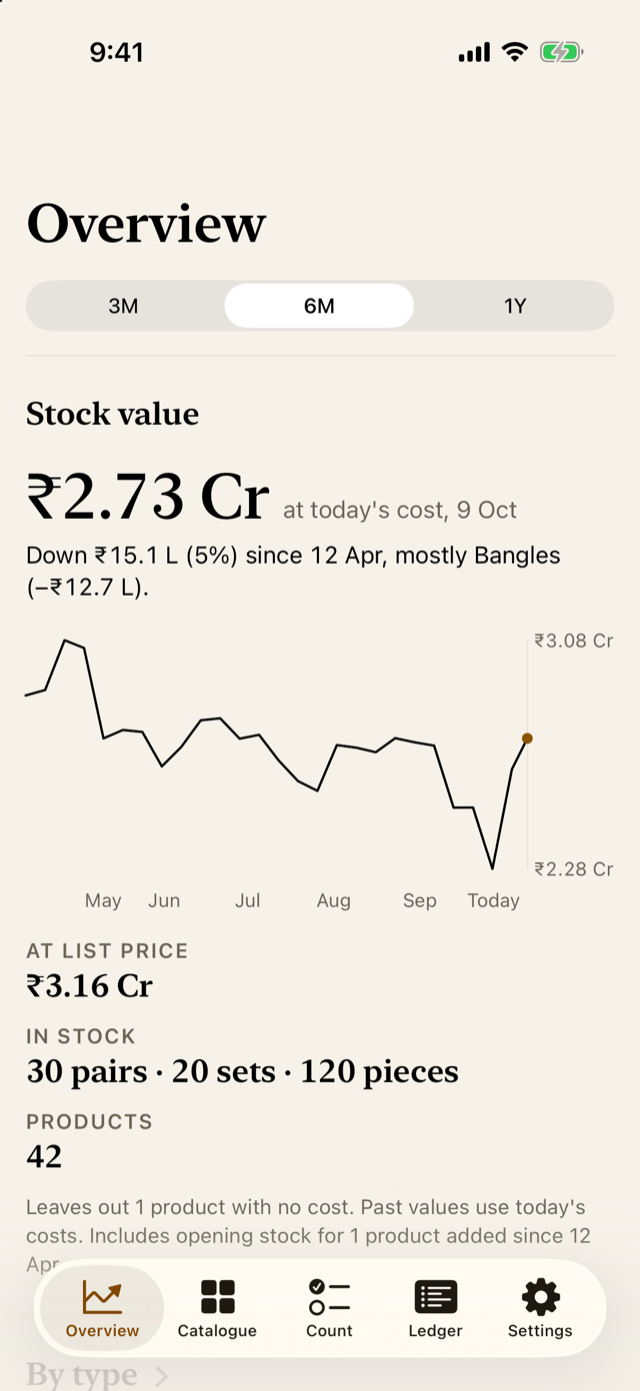
Stock value
The large figure is what the stock is worth at cost, ₹2.73 Cr “at today’s cost”. The sentence under it says how that changed over the period, and which type changed most: in the demo, “Down ₹15.1 L (5%) since 12 Apr, mostly Bangles (−₹12.7 L)”. The line shows the value week by week.
Below it: the value at list price, what’s in stock in each unit, and how many products there are. The small print says what the figure leaves out, such as products with no cost. It also says past values use today’s costs. So the line shows changes in stock, not in the price of gold.
By type, Needs attention, Sales, Best sellers and Last count
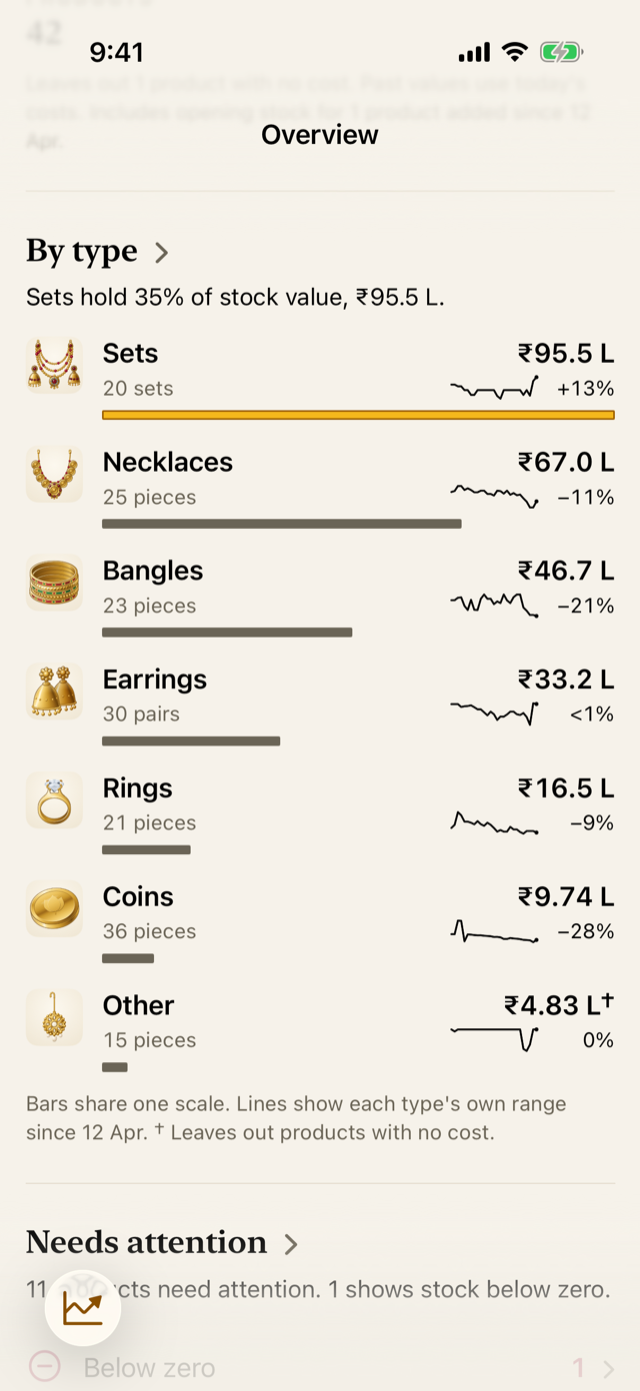
- By type shows how the value is shared between types, and how each has moved. Tap it for a chart of each type on the same scale.
- Needs attention lists products that need something done (below).
- Sales shows the value sold each week at list price, after returns.
- Best sellers lists the five products that sold the most by value.
- Last count says how the last count went, and names the type that has gone longest without a count, once that’s over 90 days.
Needs attention
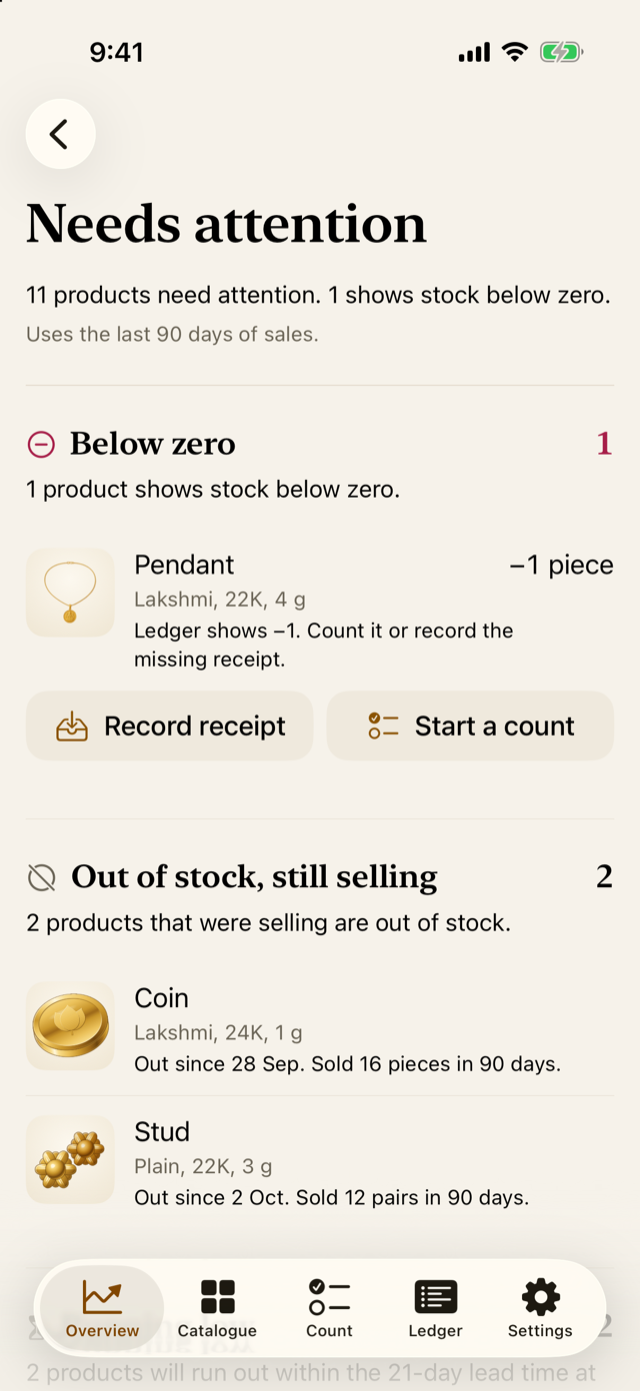
Each list has a rule, and something to do about it:
| List | Means | What to do |
|---|---|---|
| Below zero | The ledger shows less than none: a movement is missing | Record the missing delivery, or count it |
| Out of stock, still selling | None left, but it sold in the last 90 days | Reorder |
| Running low | At its recent pace (how fast it sells), the stock won’t last the supplier lead time: the days a supplier takes to deliver (21 unless you change it) | Reorder soon |
| Not selling | In stock, with no sale in 90 days | Consider a discount, a display change, or melting |
| No cost, No price | In stock with no cost or no list price, so values leave it out | Add the missing amount |
| Overdue memos | Stock sent out (jangad, karigar, or an order with a due date) more than a week past its due date | Chase it up, or record it back in |
A product only just added (in the last 30 days) isn’t called low or not selling: it hasn’t had time to show its pace.
Sales
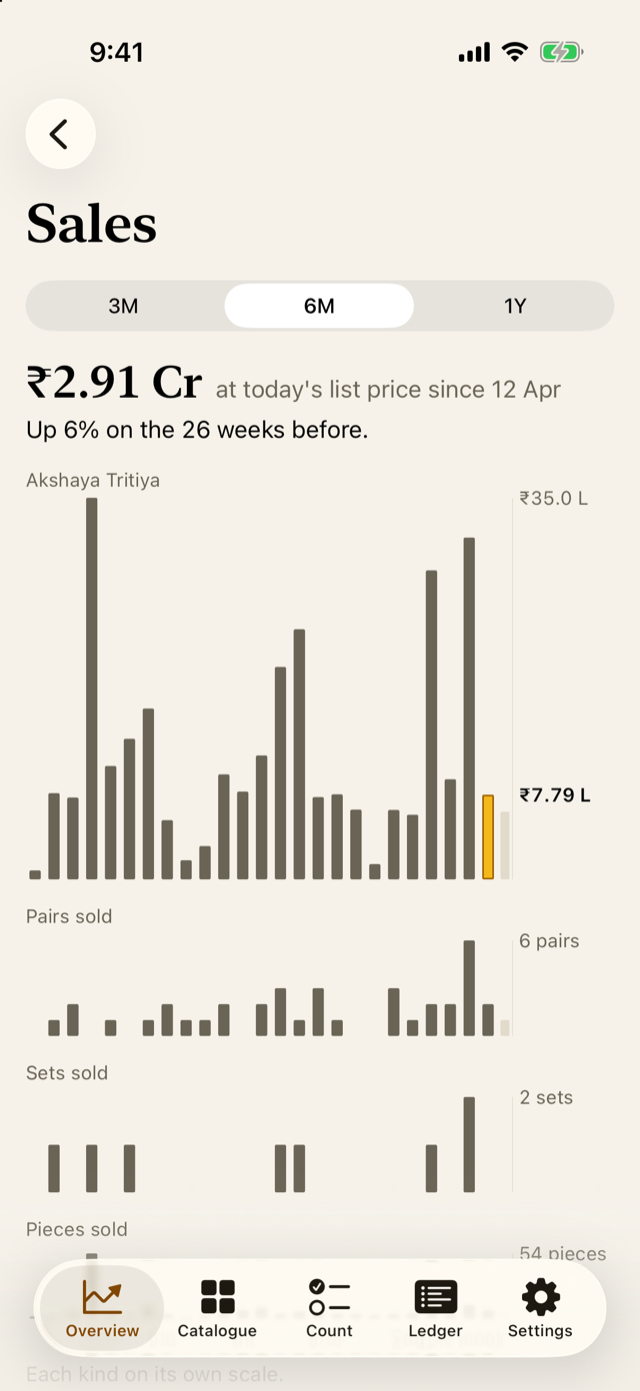
Each bar is a week, Sunday to Saturday (with the phone set to India). The last complete week is gold. The busiest week is labelled with its festival, when there was one.
7.3 Why it works this way
- Values say their basis and date (“at today’s cost, 9 Oct”; “at today’s list price”), because a figure without them can mislead.
- Sales are valued at today’s list price, not the price charged. Jholok doesn’t record discounts, so this shows how much stock sold, not the takings. Your billing system has the takings.
- Nothing is quietly left out. The small print says how many products have no cost or price, and names the types being counted.
- While a count is open, the stock of the types being counted is hidden, with a note at the top: “Stock for Necklaces is hidden while the count at Showcase 2 is open.” Sales, Best sellers and Last count stay.
7.4 How it works
The value line takes each product’s stock on each day, from the ledger, and values it at today’s cost. Archived products are left out. A product’s pace is the number it sold in the last 90 days, after returns, divided by the days it was in stock (at least 14), and its cover is how many days its stock lasts at that pace. Running low means cover shorter than the supplier lead time, which you can change in Settings → Preferences.
The sales figures are rupees at today’s list price, which can be added up. Units sold never are, because a pair, a set and a piece are different things. Under the sales bars, the Sales screen has a small panel each for pairs, sets and pieces sold, each on its own scale. Where a sentence needs a count, it lists the kinds: “Together they sold 18 pairs and 13 pieces in 90 days.” Until products have list prices, the whole Sales section works in units this way, such as “79 pairs · 17 sets · 63 pieces sold”.
7.5 Try it
These are the demo shop’s sales over the last six months. Everything here is worked out from the ledger, the same way as the app.
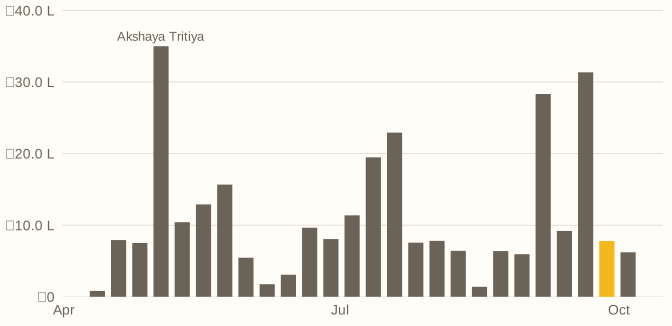
Last week the shop sold ₹7.79 L. The busiest week was Akshaya Tritiya week, 3 May, with ₹35.0 L.
And these are the products that need attention:
| List | Product | SKU |
|---|---|---|
| Below zero | Pendant, Lakshmi, 22K, 4 g | NEC-0003 |
| Out of stock, still selling | Coin, Lakshmi, 24K, 1 g | COI-0001 |
| Out of stock, still selling | Stud, Plain, 22K, 3 g | EAR-0004 |
| Running low | Bangle, Plain, 22K, size 2.4, 12 g | BAN-0001 |
| Running low | Mangalsutra, Short, black beads, 22K, 10 g | NEC-0005 |
| Not selling | Kada, Antique, 22K, 30 g | BAN-0004 |
| Not selling | Ear cuff, Filigree, 22K, 6 g | EAR-0008 |
| Not selling | Temple necklace, Lakshmi coin, 22K, 45 g | NEC-0008 |
| Not selling | Rani haar, 22K, 60 g | NEC-0009 |
| Not selling | Waist chain, Kamarbandh, 22K, 50 g | OTH-0004 |
| No cost | Waist chain, Kamarbandh, 22K, 50 g | OTH-0004 |
| No price | Coin, Silver 999, 10 g | COI-0004 |
That’s 11 products, as the Overview says.
Question. A pendant shows under Not selling. Does that mean it’s been stolen?
TipAnswer
No. It means it’s still in stock but hasn’t sold in 90 days. It may be the wrong design for this season, or not on display. Only a count can tell you whether stock is missing.
- The Overview is worked out from the ledger every time; nothing on it is typed in.
- Every value says what it’s based on: today’s cost or today’s list price.
- Needs attention says what to do: reorder, chase a memo, add a cost, or count.
- While a count is open, the stock being counted is hidden here too.